
The only performance management system that I've seen to work
Between 2009 and 2012, I experienced a performance system I’ve never forgotten; it wasn’t perfect but it’s the best I’ve seen. It brought accountability into the system - for your delivery, for the way you worked, and also for how you assessed and managed your team.
The method is called the performance-values matrix. It centres on a 4x4 grid with two axes: what you delivered (performance) and how you delivered it (values). The second half of this article is a detailed partly-AI-generated summary of the process, which was created by Jack Welch at GE. He was rather brutal / commercial in his appliation, which I would reject; but the principles stand.
The summary is:
Set expectations for performance and values
Discuss through the year
Rate your staff against both performance and values (behaviours)
Discuss with peers
Finalise
What made it work
Once a year, groups of peer managers sat in a room with an HR manager, who’d carried in a huge laminated version of this chart.
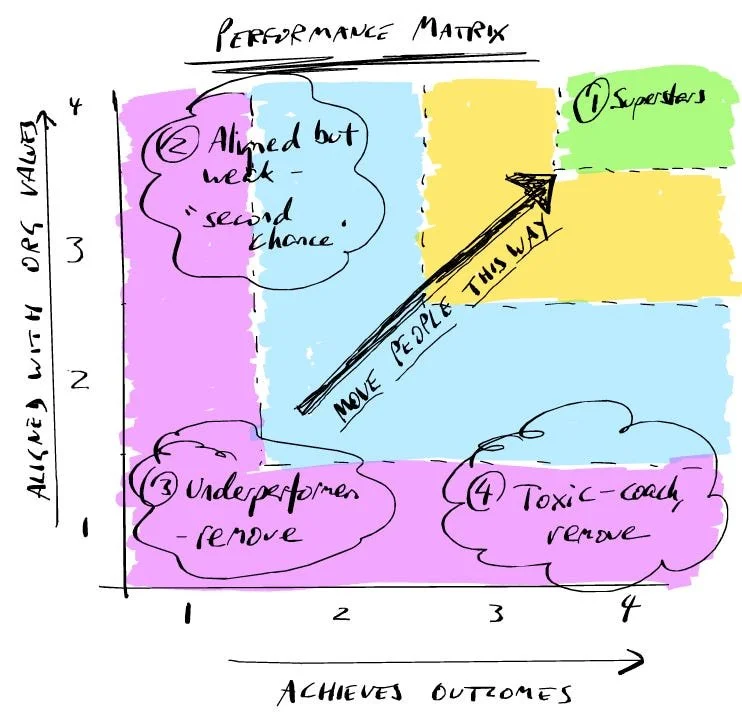
We would put our staff’s names on post-it notes and stick them on the chart. Then we’d debate.
“You’ve given Sarah a 4 on values, but when she works with my team, she’s very confrontational and inflexible.”
“Tom exceeded on performance? Only by dumping the work on my team.”
“Your entire team is 3 or above. Either you’ve got the best team in the organisation, or your standards are too low.”
Not comfortable. People defended their assessments with evidence and passion, and heard difficult truths about their staff. Sometimes accepted that their 4 was actually a 3, or that their star performer was burning bridges everywhere else. Others were persuaded that the person they thought wasn’t doing well was an absolute star in working with other departments.
Meetings ran for hours. By the end, you had calibrated performance across the organisation. More importantly, a general consensus.
Everyone did it
This wasn’t imposed on middle management while executives hid upstairs. Everyone participated. The exec team moderated managers. Managers moderated their teams. No one’s assessment was final until peers tested it.
The HR officer moderating was critical. They held the line on evidence. Challenged grade inflation. Stopped it descending into politics. They protected the integrity of the system.
The stuff no one expected
The formal purpose was met - to ensure fair, consistent performance assessment, rate people on what they delivered and how, and link consequences to ratings.
But the system created benefits beyond the ratings.
Found development opportunities. Managers discovered hidden talent in moderation. “Your James is excellent at stakeholder management? My Maria needs exactly that. She wants to move into management. Could James mentor her?” Cross-team development relationships emerged organically.
Forced external awareness. You learned how your team members were seen outside your bubble. Your star performer might be burning bridges with every other department. It wasn’t gossip - it was structured public feedback from peers whose teams had to work with your people.
Built the management team. Moderation is hard. Three hours defending your decisions, challenging peers, reaching consensus on difficult calls. Doing this together, year after year, built genuine team cohesion. You learned who brought rigour. Who was overly generous. Who had high standards but fair judgment. Managers could become a team through the difficulty of the process.
Enforced fairness. Perhaps most importantly: everyone knew poor performers couldn’t be hidden. You couldn’t protect your underperforming favourite because peers would call it out. Couldn’t quietly shuffle someone sideways, because it would surface in moderation. The system was transparent enough that people throughout the organisation understood bad apples would be dealt with. Fairness wasn’t aspirational, it was baked in.
I’d go back to my staffer with the results of the meeting. It wasn’t solely *my* judgement, which made it easier to manage tough performers (“you’re only saying that because you’re biased / you don’t understand / you dislike me” lose their power)
Why it worked
The system worked because it acknowledged a truth: managers generally don’t see their people fully.
We can overrate those we like, or make excuses for those we’ve invested in. There’s no way to see the damage - or success - people cause outside our line of sight.
Moderation didn’t eliminate these biases, but it made them visible and forced managers to defend assessments in front of people with different data. It created accountability not just downward (manager to staff) but laterally (manager to peers).
Perfect? No. It was time-consuming and sometimes quite bruising. But it is the only method I have seen that builds true accountability across an organisation.
Below is the detailed methodology: components, process, implementation requirements, origins. If you’re considering something similar, this gives you the full system. (And you’ll recognise echoes in Sinek’s video about performance vs trust referencing US Navy SEALS, if you tolerate the little sexist aside he repeats)
System overview
Name: Performance-values matrix (also called Performance-Values Match Matrix or Jack Welch Performance-Values Matrix)
Structure: 4x4 grid creating 16 boxes for employee assessment
Origins: Popularised by Jack Welch at General Electric (1981-2001), adapted by organisations globally
Core components
1. Dual assessment criteria
Performance/outputs (the ‘what’): Measures tangible results and achievement of objectives. Assesses whether the person delivered on commitments, met targets, and achieved expected outcomes.
Values/behaviours (the ‘how’): Measures how work is accomplished and whether conduct aligns with organisational values. Assesses whether someone is a good organisational citizen who embodies the desired culture.
2. Four-point rating scale
1 - Not met: Performance or values fall significantly below expectations
2 - Met: Performance or values meet baseline expectations
3 - Exceeded: Performance or values noticeably surpass expectations
4 - Exceeded greatly: Exceptional performance or exemplary values demonstration
3. Annual cycle
Year start: Managers set targets for both outputs and behaviours
Throughout year: Ongoing feedback and documentation
Year end: Assessment against targets and plotting on 4x4 grid
Post-assessment: Calibration meetings and feedback delivery
4. Calibration meetings
The defining feature of this system is the calibration (or, ‘moderation’) process, which ensures consistency across the organisation.
Structure:
Attended by peer-level managers (colleagues of the direct manager)
Each manager presents ratings for their staff members
Group discusses and challenges ratings to reach consensus
Cross-validates assessments (someone might excel with their team but be difficult with others)
Prevents grade inflation and ensures fairness
5. Consequences
Upper quadrants (3+ on both axes): Performance bonuses, biggest bonus for 4-4 scores
Score of 1 on either axis: Performance improvement plan
Overall focus: Moving people toward upper right quadrant
Understanding the 16 boxes
The 4x4 matrix creates 16 possible combinations. Here are the key quadrants and their implications:
Upper right (High performance, high values)
Scores: 4-4, 4-3, 3-4, 3-3
Description: Stars and high performers, your organisational assets
Action: Retain, reward, develop, and promote. Invest heavily in continued growth. Use as role models and mentors.
Jack Welch called these ‘Type 1’ employees.
Lower right (High performance, low values)
Scores: 4-1, 4-2, 3-1, 3-2
Description: Toxic high performers who deliver results but damage culture and team morale
Challenge: Most difficult decisions for managers. Often charismatic but corrosive to others.
Action: Coaching on values, then removal if no change. Individual contribution doesn’t outweigh cultural damage.
Jack Welch called these ‘Type 4’ employees and insisted on their removal despite performance.
Upper left (Low performance, high values)
Scores: 1-4, 2-4, 1-3, 2-3
Description: Cultural fits who underperform. Good people who align with values but can’t deliver results.
Possible causes: Lack skills, in wrong role, or need better support
Action: Training, reassignment, or managed exit. Worth investing time if values alignment is strong.
Jack Welch called these ‘Type 2’ employees and gave them a second chance.
Lower left (Low performance, low values)
Scores: 1-1, 1-2, 2-1, 2-2
Description: Clear underperformers who neither deliver results nor embody values
Action: Immediate performance improvement plan or exit. Drain on organisational resources.
Jack Welch called these ‘Type 3’ employees.
Detailed annual process
Month 1-2: Goal setting
Individual meetings between manager and each staff member
Set specific, measurable performance objectives
Define behavioural expectations aligned to organisational values
Document targets in writing
Both parties sign off on agreed objectives
Throughout year: Ongoing feedback
Regular check-ins (monthly or quarterly)
Mid-year reviews to adjust targets or change supports if needed
Real-time feedback on both performance and values
Documentation of significant achievements or concerns
Month 12: Year-end assessment
Manager evaluates each staff member against set targets
Assigns preliminary ratings (1-4) for both performance and values
Gathers evidence and examples to support ratings
Plots each person on the 4x4 matrix
Prepares written assessment and supporting documentation
Month 1: Moderation meetings
This is the critical calibration stage that ensures consistency across the organisation.
Attendees:
5-8 peer managers (people at same organisational level)
Often facilitated by the level-up manager or HR
Sometimes includes representation from other functions
Meeting process (typically 3-4 hours):
Opening: Ground rules reminder - candour and honesty required, challenge respectfully, focus on evidence
Individual presentations: Manager presents each staff member’s ratings with specific examples (15-20 minutes each)
Calibration discussion: Group debates ratings, cross-functional perspectives shared, hidden issues revealed
Consensus building: Agreement on final ratings, movement of people between boxes, documentation of reasoning
Wrap-up: Final matrix agreed, actions noted, next steps confirmed
January-February: Feedback and outcomes
Managers communicate final ratings to staff
Performance bonuses awarded to 3+ scorers
Performance improvement plans for 1-scorers
Development plans created for all staff
…which all lead into the target setting that starts the cycle afresh
Implementation requirements
Successful implementation requires templates, training, and clear communication materials.
1. Performance planning documents
Performance and values planning template (objectives, success measures, behavioural expectations)
Mid-year review template (progress tracking, adjustments needed)
2. Assessment documents
Year-end assessment form (evidence, ratings, comments)
Moderation summary sheet (one-pager per person for calibration meetings)
Master matrix document (visual grid showing all staff)
3. Meeting facilitation materials
Moderation meeting agenda (time allocations, ground rules, running order)
Calibration guidelines document (rating definitions, examples, decision tree)
Evidence recording template (for documenting discussion and decisions)
4. Training materials
Manager training: Performance planning (SMART objectives, behavioural expectations, evidence gathering)
Manager training: Assessment and rating (fair assessment, avoiding bias, evidence-based rating)
Manager training: Moderation process (preparation, advocacy, challenging respectfully, consensus-building)
Senior leader training: Facilitation (running meetings, managing difficult conversations, building trust)
5. Communication materials
System overview briefing for all staff (why, how it works, FAQs)
Manager briefing pack (detailed timeline, templates, support available)
Moderation meeting briefing (for first-time attendees)
6. Outcome documents
Performance improvement plan template (for anyone rated 1 on either dimension)
Development plan template (for all staff)
Salary uplift or Bonus calculation guidance (how ratings translate to percentages) - if the organisation incentivises this way. Access to elite training or secondments is another possible incentive
Key success factors
Strong facilitation: Skilled moderators who can manage debate and build consensus
Culture of candour: Willingness to have difficult, honest conversations about performance
Evidence-based assessment: Focus on specific examples and data, not opinions
Trust between managers: Peer managers must trust each other to challenge constructively
Clear definitions: Shared understanding of what each rating level means
Organisational commitment: Leadership support and willingness to invest time in the process
Consistent application: Same standards applied across all departments and levels
Bibliography and further reading
Primary sources
Welch, J. with Byrne, J.A. (2001). Jack: Straight from the Gut. New York: Warner Books.
Welch’s autobiography covering his GE career. Discusses the vitality curve, Session C people review process, and the four types of managers based on performance and values.
Welch, J. with Welch, S. (2005). Winning. New York: HarperCollins.
Comprehensive management guide with chapters on differentiation, the 20-70-10 system, candour in performance management, and people management principles.
Academic and practitioner sources
Buchko, A.A. and Buchko, K.J. (2012). ‘Values-Based Management or The Performance-Values Matrix: Was Jack Welch Right?’ Journal of Business & Leadership: Research, Practice, and Teaching, Vol. 8, No. 1, pp. 69-83.
Empirical study testing Welch’s approach, finding that performance and values are independent constructs.
Slater, R. (2003). Jack Welch and the GE Way. New York: McGraw-Hill.
Analysis of Welch’s management methods, including forced ranking, differentiation, and case studies of GE practices.
Online resources
Performance-values matrix and 9 Box grids: Multiple business sites provide overviews of the system, implementation guidance, and comparisons with similar tools (search for ‘Jack Welch performance values matrix’ or ‘9 box grid’)
Vitality curve: Wikipedia and business publications document the history of forced ranking systems, including GE’s 20-70-10 approach, controversy, and decline in use
Critical perspectives
Kantor, J. and Streitfeld, D. (2015). ‘Inside Amazon: Wrestling Big Ideas in a Bruising Workplace’ The New York Times.
Discusses forced ranking systems and notes that Microsoft, GE, and Accenture dropped the practice.
Cappelli, P. and Tavis, A. (2016). ‘The Performance Management Revolution’ Harvard Business Review.
Documents move away from annual reviews and forced rankings, including GE’s shift post-2015.
First published in Strategy, Applied.
